bpro Desktop Monitoring 24×7
Window Desktop data collection for relatime products with latest data and Report analysation.


Desktop 24×7 Monitoring
Window Desktop data collection for relatime products with latest data and Report analysation.
- Monitoring of the ambient conditions in buildings.
- Monitoring of temerature , humidity & moisture in research and development, laboratories and hospitals.


Overview
Complies with 21 CFR Part 11 Compliance
Clear Monitoring View
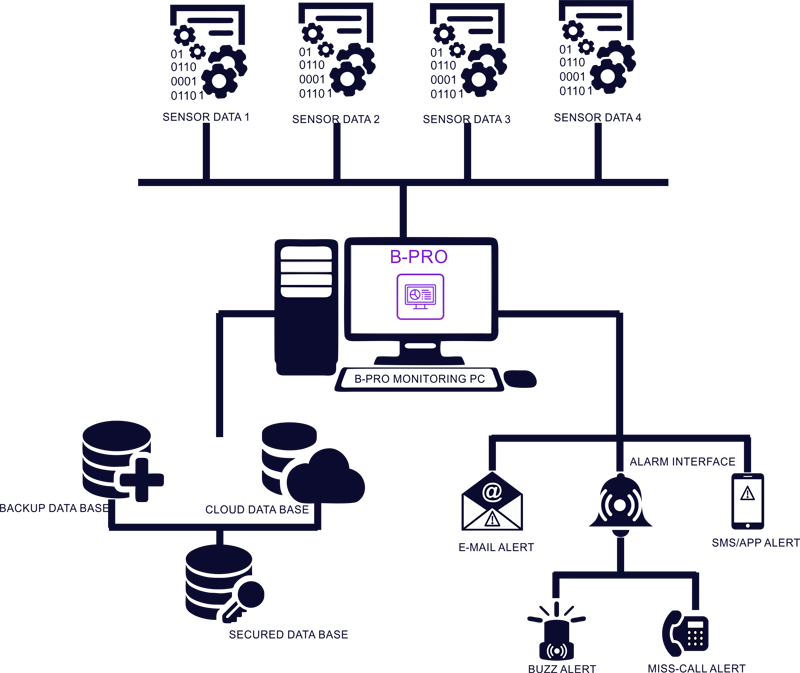
Custom alert Notification
Email Notification
Data Export Option
Data Report – Chart, Table & Statistics
Audit Trail Report
USER Security – Password Protected
Data Security – Encrypted Database
Software Security : 3 level of access to operate the Application
Support any Type of Data Logger
Backup and Archive
-
Data Logger /Sensor Configuration such as name setup to display in Screening, alarm Threshold settings for deviation, delay alarm to generate the alarm, etc.,
-
Setup the Sensor / Data logger Communication type Email configuration for automatic email report or notification.
-
New user creation, lock user account, restricts user access for specific period.
-
Database Archive
-
External device setup for alarm notification
-
Data Report signature setup, Company Logo setup, Chart setup like Link style, width,colour etc.,


- Collect Sensor data and display
- Highlighting the threshold deviation or any failures
- Comments for the sensor data
- Grid view or List View(optional)
-
View History – Database / Archive Records
-
Data View – Chart , Tabular , Statistics
-
Filter option – By Date Time, By Data Type (Valid Data/Failure), By Sensor
-
Archive Sensor Record
-
Export – PDF / PRINT


-
View History – Event Database / Event ArchiveRecords
-
Filter option – By Date Time, By Data Type (Valid Data/Failure), Event Type
-
Export – PDF / PRINT

